How to sequence the 21 dimensions of an operating model
An operating model explains how an organisation converts strategy into reliable delivery. It connects capabilities, processes, governance, data, technology, people, assets and supporting services into one coherent system.
However, organisations cannot design and implement every operating model dimension at the same time. Some dimensions create the foundations for others. Some require major investment, organisational maturity or technical integration. A useful operating model roadmap must therefore show both when work should happen and how ready each dimension currently is.
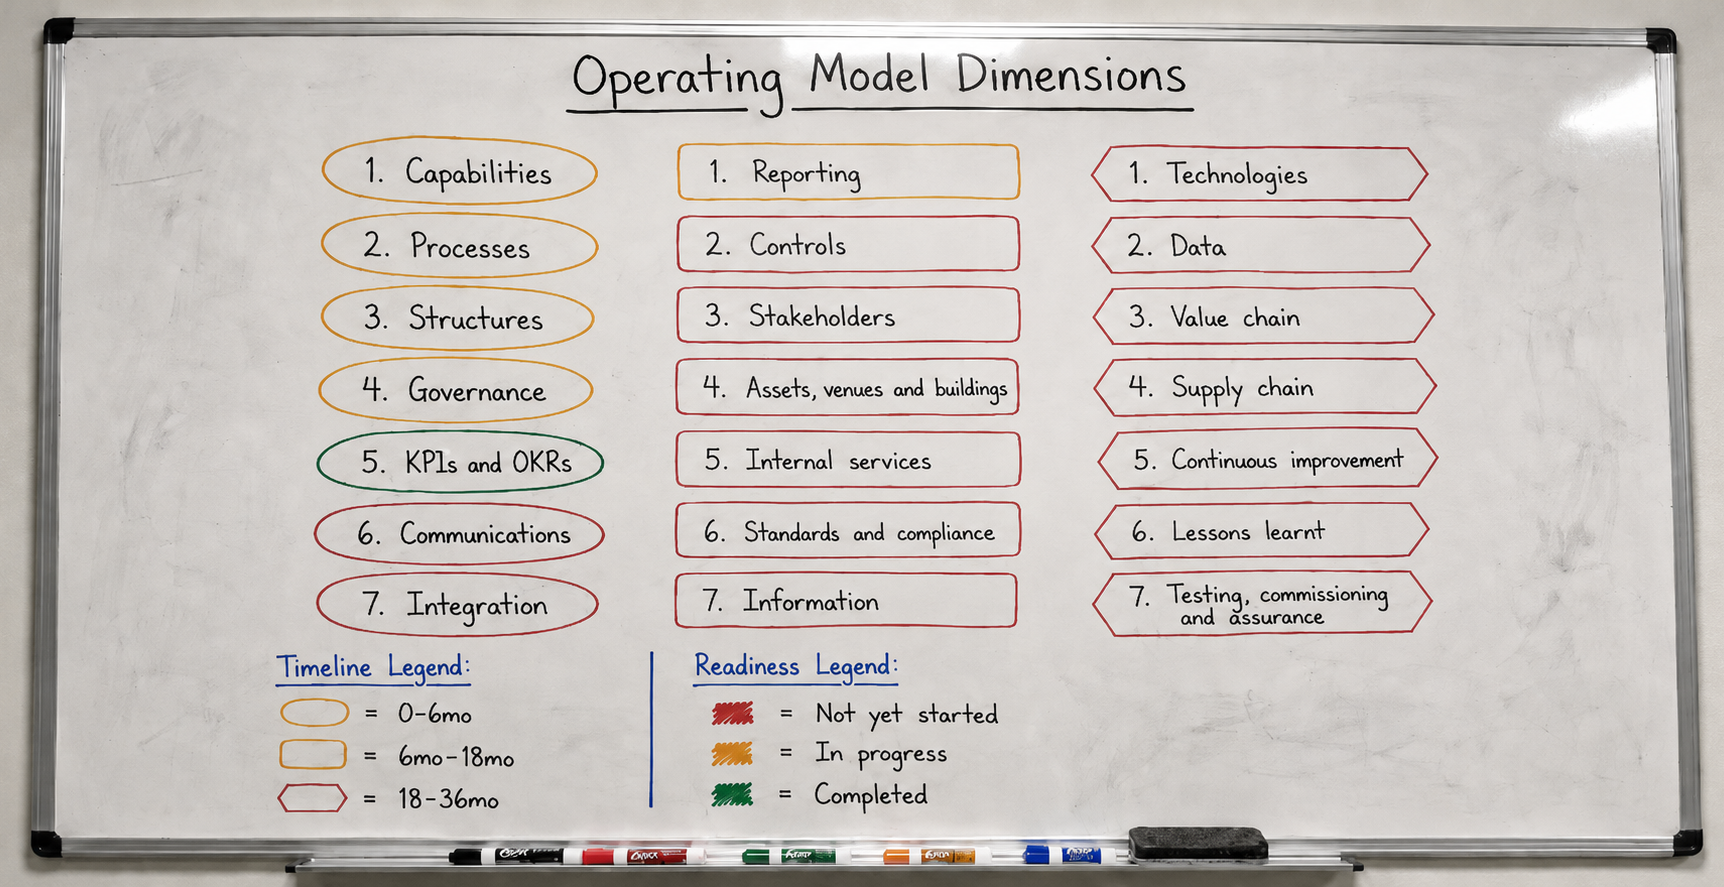
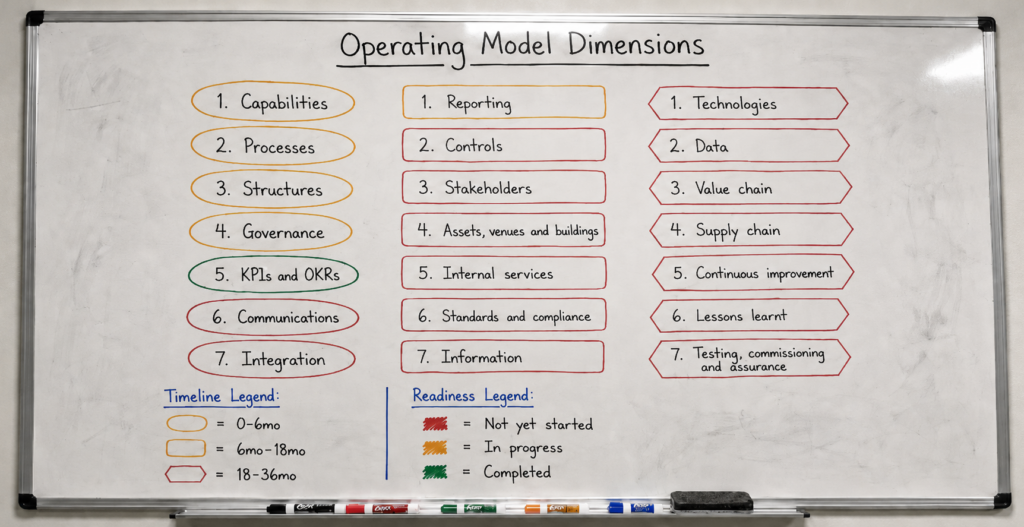
The whiteboard illustrates this approach by mapping 21 operating model dimensions against timeline and readiness.
The 21 operating model dimensions
The model covers:
- Capabilities
- Processes
- Governance
- Controls
- Reporting
- Data
- KPIs and OKRs
- Structures
- Technologies
- Assets, venues and buildings
- Stakeholders
- Value chain
- Standards and compliance
- Information
- Communications
- Continuous improvement
- Lessons learnt
- Supply chain
- Integration
- Testing, commissioning and assurance
- Internal services
Together, these dimensions provide a broad view of how an organisation functions. They extend beyond organisation charts and process maps. They address the management mechanisms, information flows, physical environment, technical systems and support arrangements required for sustained performance.
Using shapes to show the implementation timeline
The diagram uses three shapes to represent different delivery periods.
Oval shapes identify dimensions that require attention within the first six months. These include capabilities, processes and structures, together with several supporting dimensions.
This early phase should establish the organisation’s essential foundations. Leaders need to understand which capabilities the organisation requires, how core work should flow and how roles should align with delivery. Without this clarity, later investments may automate weak processes or reinforce unsuitable structures.
Rounded rectangles represent dimensions planned for the six-to-eighteen-month period. These include reporting, controls, stakeholders, assets and internal services.
During this phase, the organisation should strengthen management discipline and operational coordination. Reporting should give decision-makers useful information rather than simply producing additional documents. Controls should manage material risks without creating unnecessary bureaucracy. Stakeholder arrangements should define how the organisation identifies, understands and responds to different interests.
The longer-term hexagonal shapes represent dimensions expected to mature after eighteen months. These include technologies, data, value chains and supply chains.
These areas often require more extensive investment and integration. Technology implementation depends on clear requirements, stable processes and defined ownership. Data improvement requires common definitions, governance and reliable sources. Value-chain and supply-chain redesign may involve suppliers, customers, contracts and operating partners beyond the organisation’s direct control.
The timeline does not suggest that leaders should ignore later dimensions during the early stages. Teams should consider dependencies from the beginning. However, they should avoid treating every dimension as an immediate implementation priority.
Using colour to show readiness
The diagram also uses colour to show three readiness states:
- Red indicates not yet started.
- Amber indicates work in progress.
- Green indicates completion.
Around 70% of the dimensions remain not yet started. Several foundational dimensions are in progress, while only KPIs and OKRs are complete.
This distribution creates a realistic baseline. Operating model assessments often become less useful when teams describe partially defined or undocumented arrangements as complete. A red status should not create embarrassment. It should create clarity.
A credible readiness assessment enables leaders to allocate resources, identify dependencies and manage delivery expectations. It also reveals where apparent progress in one area may depend on unresolved work elsewhere.
For example, an organisation may define KPIs and OKRs before completing its data model. In that situation, it should test whether the required information exists, whether teams interpret measures consistently and whether reporting processes can produce results reliably.
Turning the diagram into a working roadmap
The whiteboard should act as a starting point rather than a finished operating model.
Each dimension needs a defined outcome, accountable owner, delivery milestones, dependencies and completion criteria. Leaders should review progress regularly and change the sequence when evidence justifies it.
Completion should also mean more than producing a document. A process is not complete merely because someone has drawn it. A governance model is not complete because a committee has approved its terms of reference. A technology solution is not complete when the system goes live.
A dimension reaches maturity when people can use it consistently, management can test its effectiveness, and the organisation can improve it using evidence.
By combining timeline shapes with readiness colours, the model gives leaders a simple way to communicate a complex transformation. It shows where the organisation needs to act first, what remains incomplete and how the individual dimensions contribute to a coherent operating model.